Animated Visualizers
Contents
Animated Visualizers
This page contains animated visualizations for the OscillationMethods project, stepping through each of the 7 topics.
The code to create these visualizations is openly available here. If you wish to use any of these visualizations, please cite the Oscillation Methods paper.
Intro: Oscillation Visualizers
In this page, we will use a series of animated visualizers to demonstrate what we think are some important methodological considerations, organized into 7 key topics or recommended “checks”. These figures are created with simulated data in order to demonstrate particular topics of interest when examining oscillations.

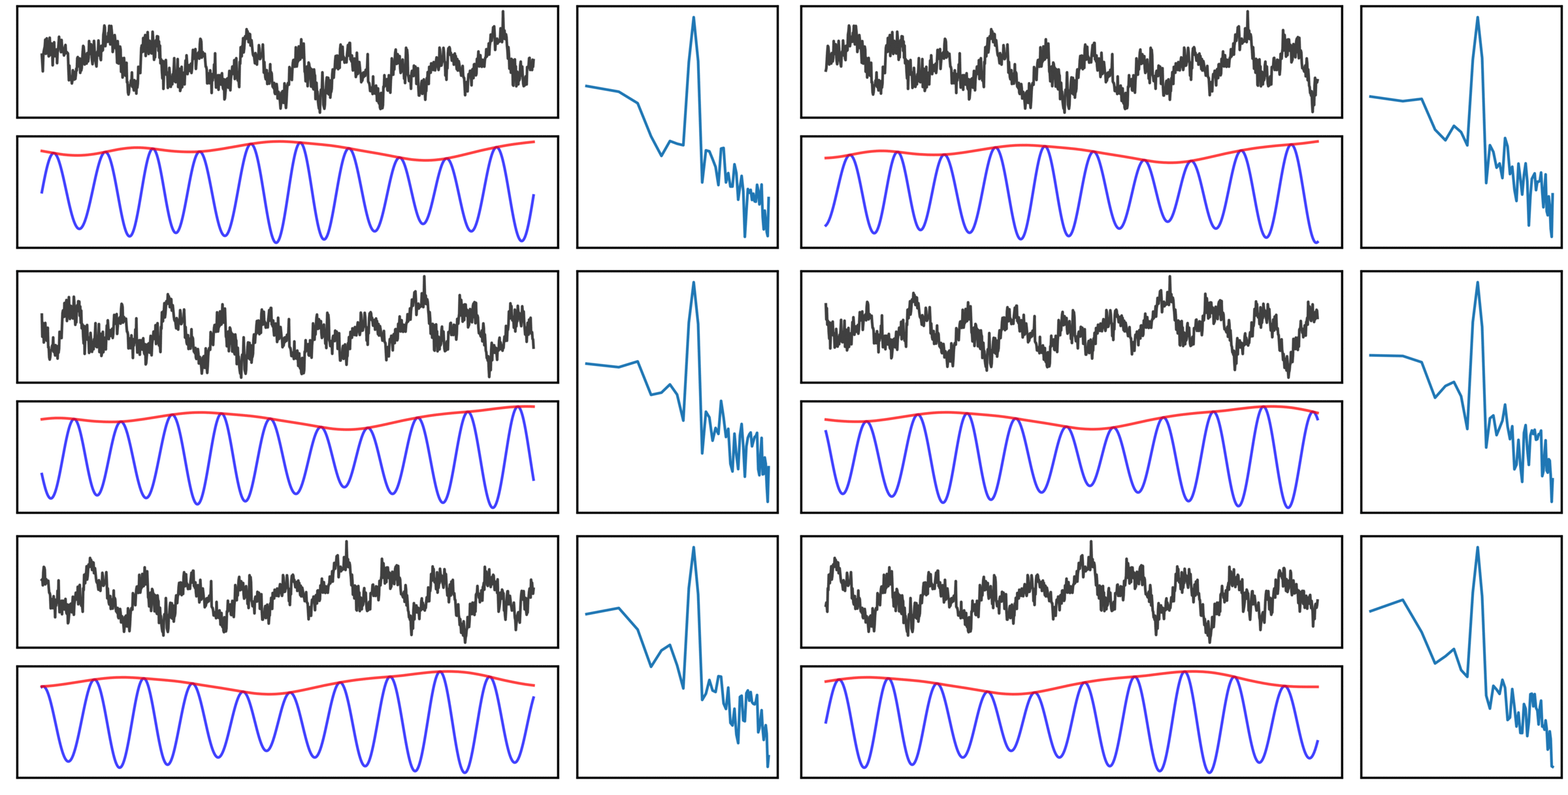
In the visualization above, a simulated neural signal, containing both an oscillation and an aperiodic component (black) is shown, along with the corresponding power spectrum to the right, and below, the filtered signal (blue) and instantaneous amplitude (red).
#1 Oscillation Presence
The first recommendation is to start by detecting neural oscillations!
Neural oscillations are not always present. Measures, such as narrowband filters can give results that appear oscillatory, but actually reflect non-oscillatory (‘aperiodic’) aspects of the data.

In the visualization above, the simulated time series (top left; black) is purely aperiodic, as can also be seen in the power spectrum below. The shaded regions indicate canonical frequency bands (delta - yellow; theta - green; alpha - blue; beta - purple). To the right, is the filtered signal, in canonical frequency ranges. Note that despite being simulated with no rhythmic activity, the filtered signals appear to be rhythmic.
#2 Center Frequency
The second recommendation is to examine defined frequency bands to evaluate if they match the data!
Oscillation frequencies can be idiosyncratic, meaning predefined band ranges (ex. alpha: 8-12) may lead to misestimations of power and/or lead to power “bleeding” into adjacent frequency bands.

In the visualization above, two example signals are shown, one with a canonical alpha signal (blue - 10 Hz), and another with a variable alpha center frequency (green). As can be seen in the filtered traces, and band power measures, variance in center frequency can affect measures of band power.
#3 Aperiodic Activity
The third recommendation is to examine if aperiodic activity is contributing to and/or may explain measure changes!
Neural activity also contains dynamic aperiodic (1/f-like) activity, which can influence band power measures & relative power. Because of dynamic aperiodic activity, one may need to control for changes in non-oscillatory activity!

In the visualization above, two signals (power spectra are compared), in which one is ‘spectrally rotated’, reflecting a difference in the aperiodic component of the signal.
#4 Temporal Variability
The fourth recommendation is to consider temporal variability (burstiness), including, for example, using burst detection to see if burstiness might impact measures / explain differences in measures of interest.
Oscillations are temporally variable, which can influence measures in ways that can be misinterpreted as changes in (continuous) power.

In the visualization above, different temporal properties of the signal are shown, each which reflect the same difference in power in the alpha band, arising from differences in burst features. These differences include true difference in the amount of the power of the oscillation, differences in burst duration (how many cycles a burst lasts), and differences in burst occurrence (how often a burst happens).
#5 Waveform Shape
The fifth recommendation is to examine waveform shape, to evaluate if and how any non-sinusoidalities may be influencing measures of interest.
Oscillations are often non-sinusoidal which, in Fourier based measures, leads to “harmonics” and influences measures like phase-amplitude coupling.

In the visualization above, two signals are compared, one being a pure sinusoid (black), and another with variable waveform shape properties (green). In the power spectrum (right) and the band power measures, we can see that the waveform shape create harmonics that lead to measured beta beta. In addition, this harmonic power leads to measured phase-amplitude coupling (PAC) between alpha and higher frequencies, despite there only being one rhythmic component in the signal.
#6 Overlapping Sources
The sixth recommendation is to address overlapping sources, by using source separation to check for and isolate components.
Electrodes often can record multiple overlapping sources, wherein differences in frequency and/or phase of distinct sources can influence the measured surface potential.

In the visualization above, two sources (red and blue) are simulated, and measured as an overlying electrode (green). Note that the simulated signals are non-sinusoidal, and thus have harmonic peaks. Represented is cases in which the two sources have variable frequency or variable phase, and how these lead to different recordings at the overlying electrode.
#7 Signal-to-noise ratio
The seventh recommendation is to check the signal-to-noise ratio (SNR) to evaluate if there is sufficient SNR for computing measures of interest.
As oscillatory power decreases, estimates get noisier, which can lead to misestimations and potentially precludes clear interpretation of derived measures.

In the visualization above, a signal with variable oscillation power (SNR) is simulated, with representations of the power spectrum, raw time series, filtered time series, and instantaneous phase and frequency. Note that the simulated oscillation is consistently present in all cases - variability of the measures is due to noisy estimates when the signal power is low.
